Plot solutions
Plotting calibration solutions is not available for GitHub-built releases of
hyperdrive. hyperdrive must be built with the plotting cargo feature;
see the installation from source instructions
here.
hyperdrive is capable of producing plots of calibration solutions for any of
its supported file formats. Note that only
hyperdrive-formatted calibration solutions can contain tile names; when tile
names are unavailable, they won't be on the plots unless a corresponding
metafits file is provided. With or without tile names, an index is provided.
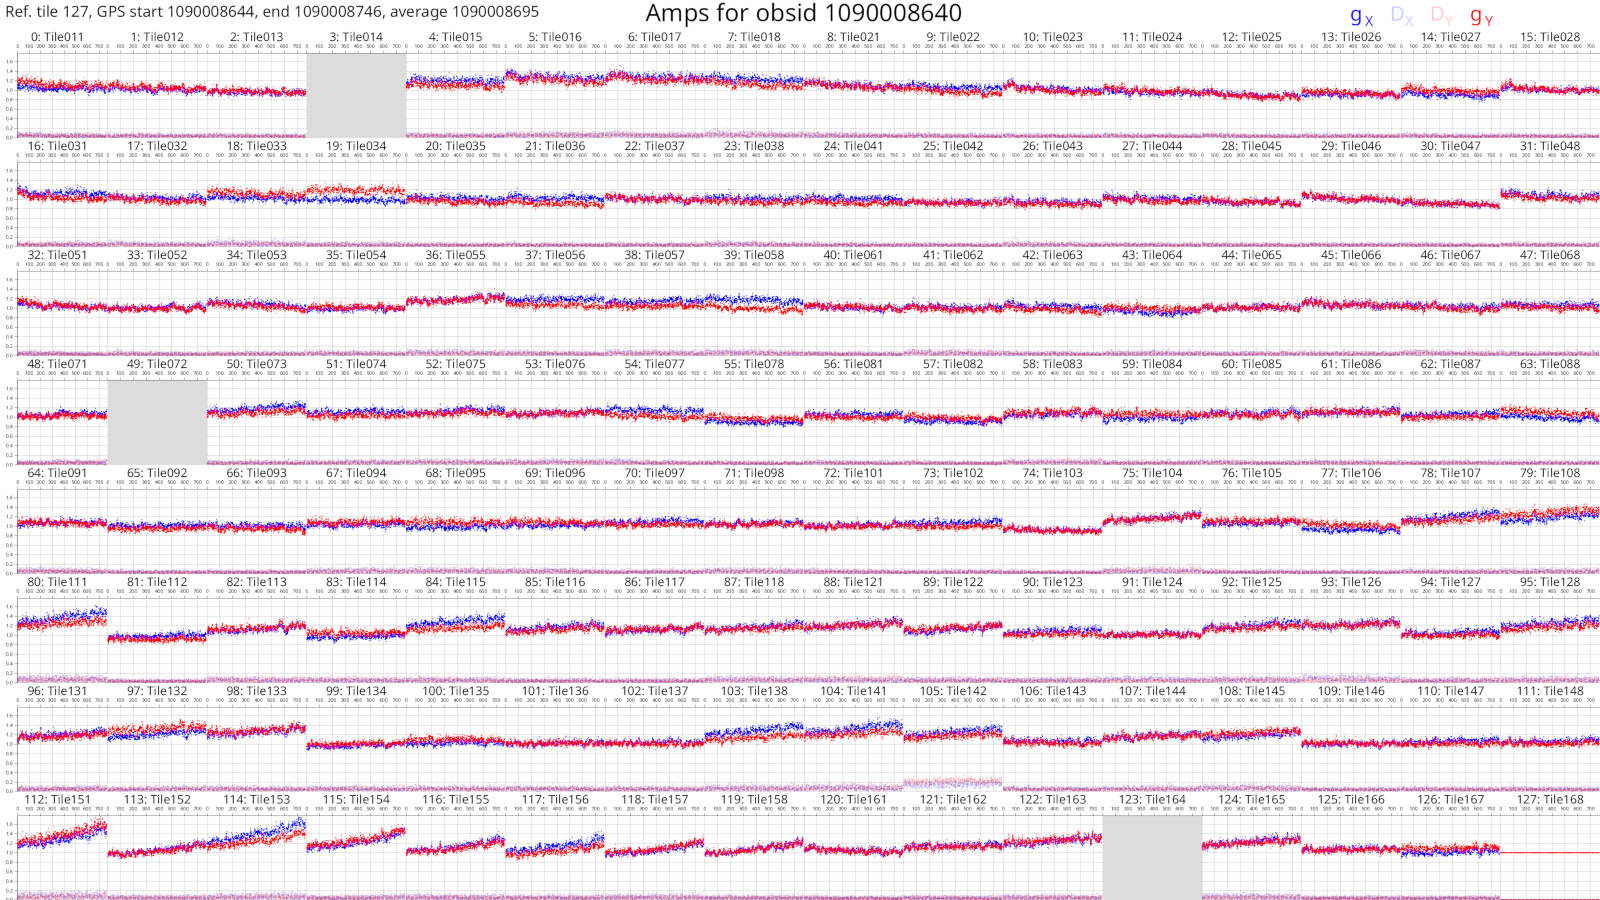
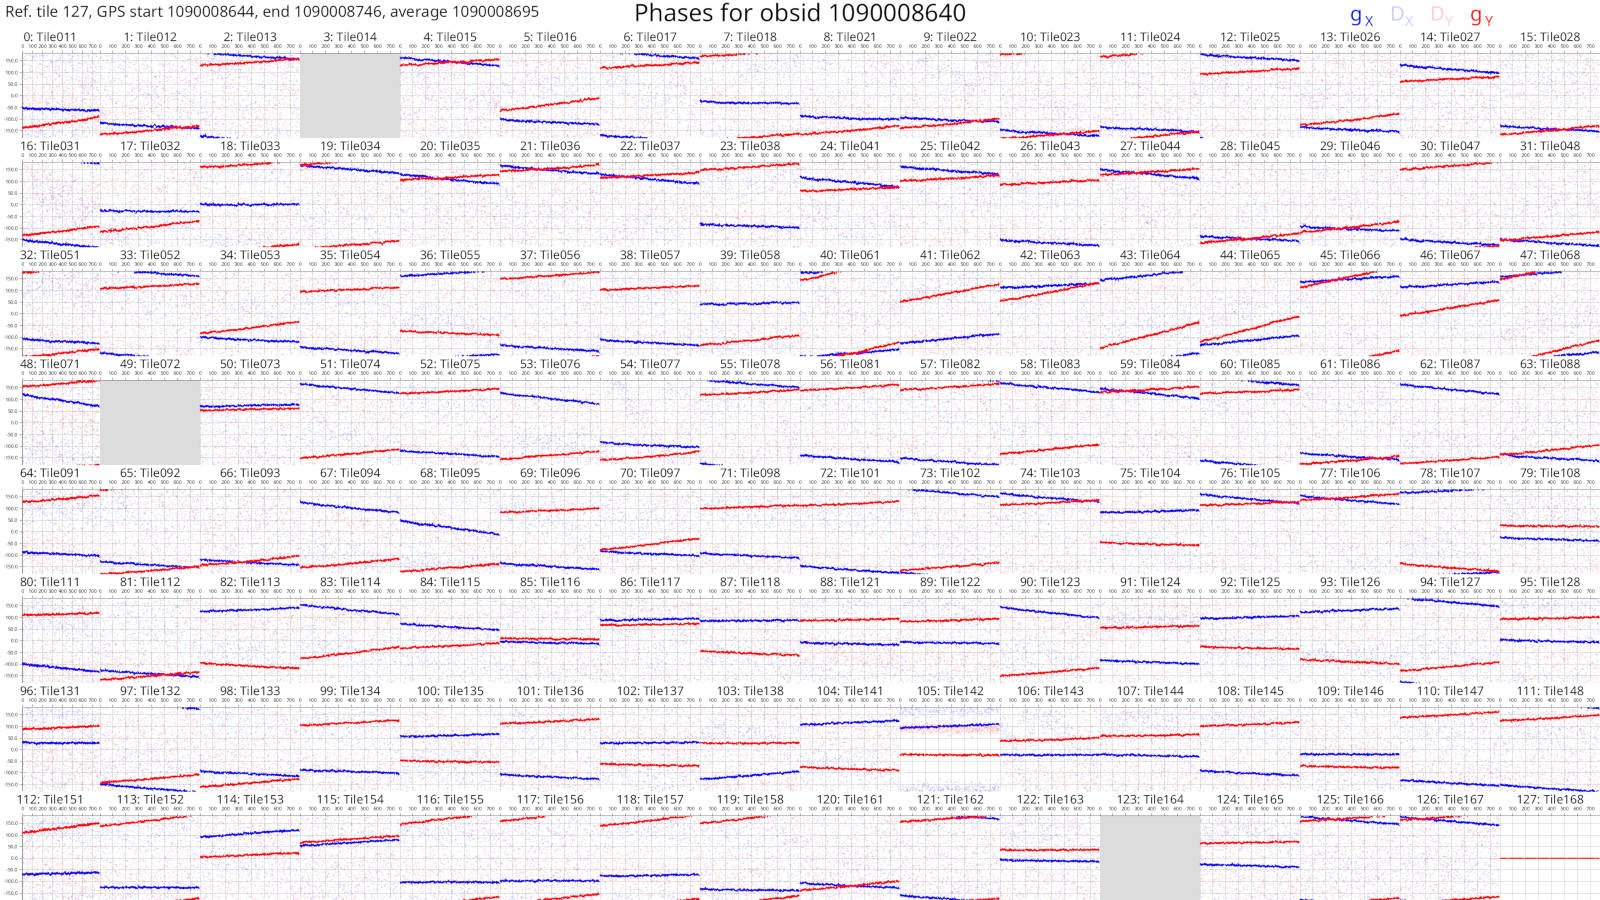
By default, a reference tile is selected and reported at the top left of the plot. (By default, the last tile that isn't comprised of only NaNs is selected, but this can be manually chosen.) It is also possible to neglect using any reference tile. With a reference tile, each tile's solutions are divided by the reference's solutions, and the resulting Jones matrix values are plotted (the legend is indicated at the top right of each plot). \( g_x \) is the gain on a tile's X polarisation and \( g_y \) is the gain on a tile's Y polarisation. \( D_x \) and \( D_y \) are the leakage terms of those polarisations.
By default, the y-axis of amplitude plots capture the entire range of values.
These plots can therefore be skewed by bad tiles; it is possible to control the
range by specifying --max-amp and --min-amp.
If a calibration solutions file contains multiple timeblocks, plots are produced for each timeblock. Timeblock information is given at the top left, if available.
Example plots
Amplitudes ("amps")

Phases
